1. Overview
Background
At the floor layout stage of a data center, a number of alternatives have to be compared by varying parameters such as rack arrangement, supply air volume and perforated tile placement. General-purpose CFD is accurate but takes long enough per case that reviewing a sufficient number of alternatives is impractical.
Boreas FFD is a solver based on Fast Fluid Dynamics aimed at this screening stage. It uses semi-Lagrangian time integration so that it converges on coarse grids and with large time steps, and it computes one layout in minutes to tens of minutes.
Choosing the subject
Real data centers have rack rows of varying length, standalone racks, PDUs occupying aisles, and a different number and placement of perforated tiles in each aisle. The usefulness of a screening tool has to be demonstrated on exactly this kind of irregular layout.
The facilities in the projects we have actually carried out cannot be disclosed. Most data centers in Korea are designated critical security facilities, and the rack layout and heat distribution are themselves the customer’s equipment information. For this case study we therefore chose a measured data center whose geometry and operating conditions are published. Most of the input conditions are public, so readers can check the analysis conditions directly, and the same problem can be computed with another tool for comparison.
This is an application case reconstructed from conditions reported in the literature. Quantitative validation is not covered, because of the limits of the information the literature provides. Quantitative validation of the solver is carried out separately against literature benchmarks.
2. Subject and model
The subject is a raised-floor data center of about 690 m² in Massachusetts, USA. The reference literature gives 151 racks, 12 PDUs, 183 floor perforated tiles at 25% open area and 42 ceiling return tiles. Total facility power is about 344 kW and total cooling supply air volume is 152,000 m³/h.
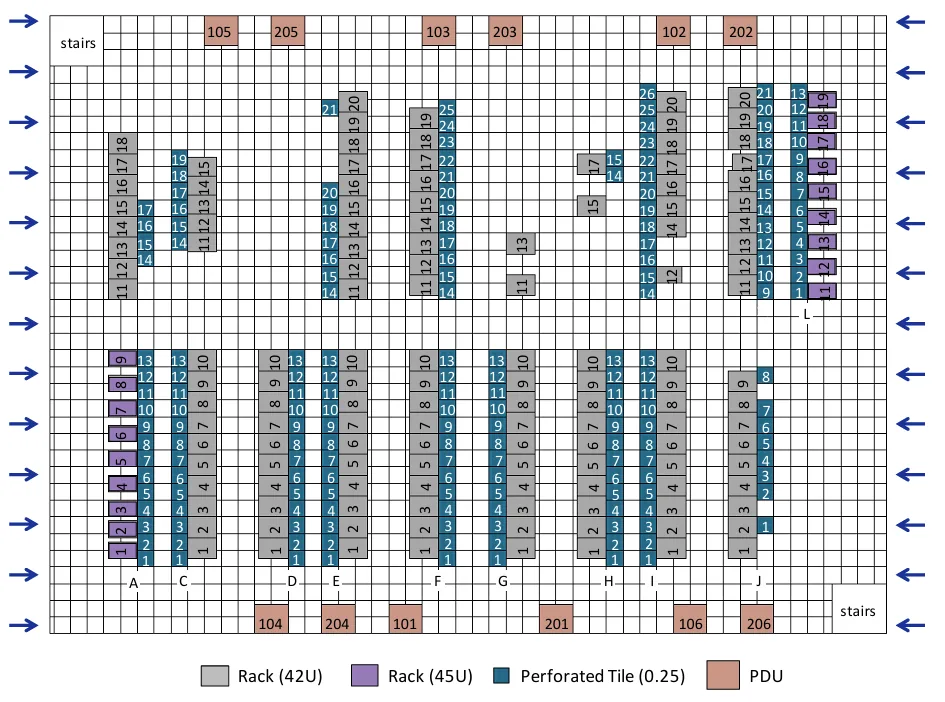
The plan shows 42U and 45U racks, perforated tiles and PDUs arranged irregularly. Long rack rows are mixed with short groups of racks, and the number and placement of perforated tiles differ from aisle to aisle.
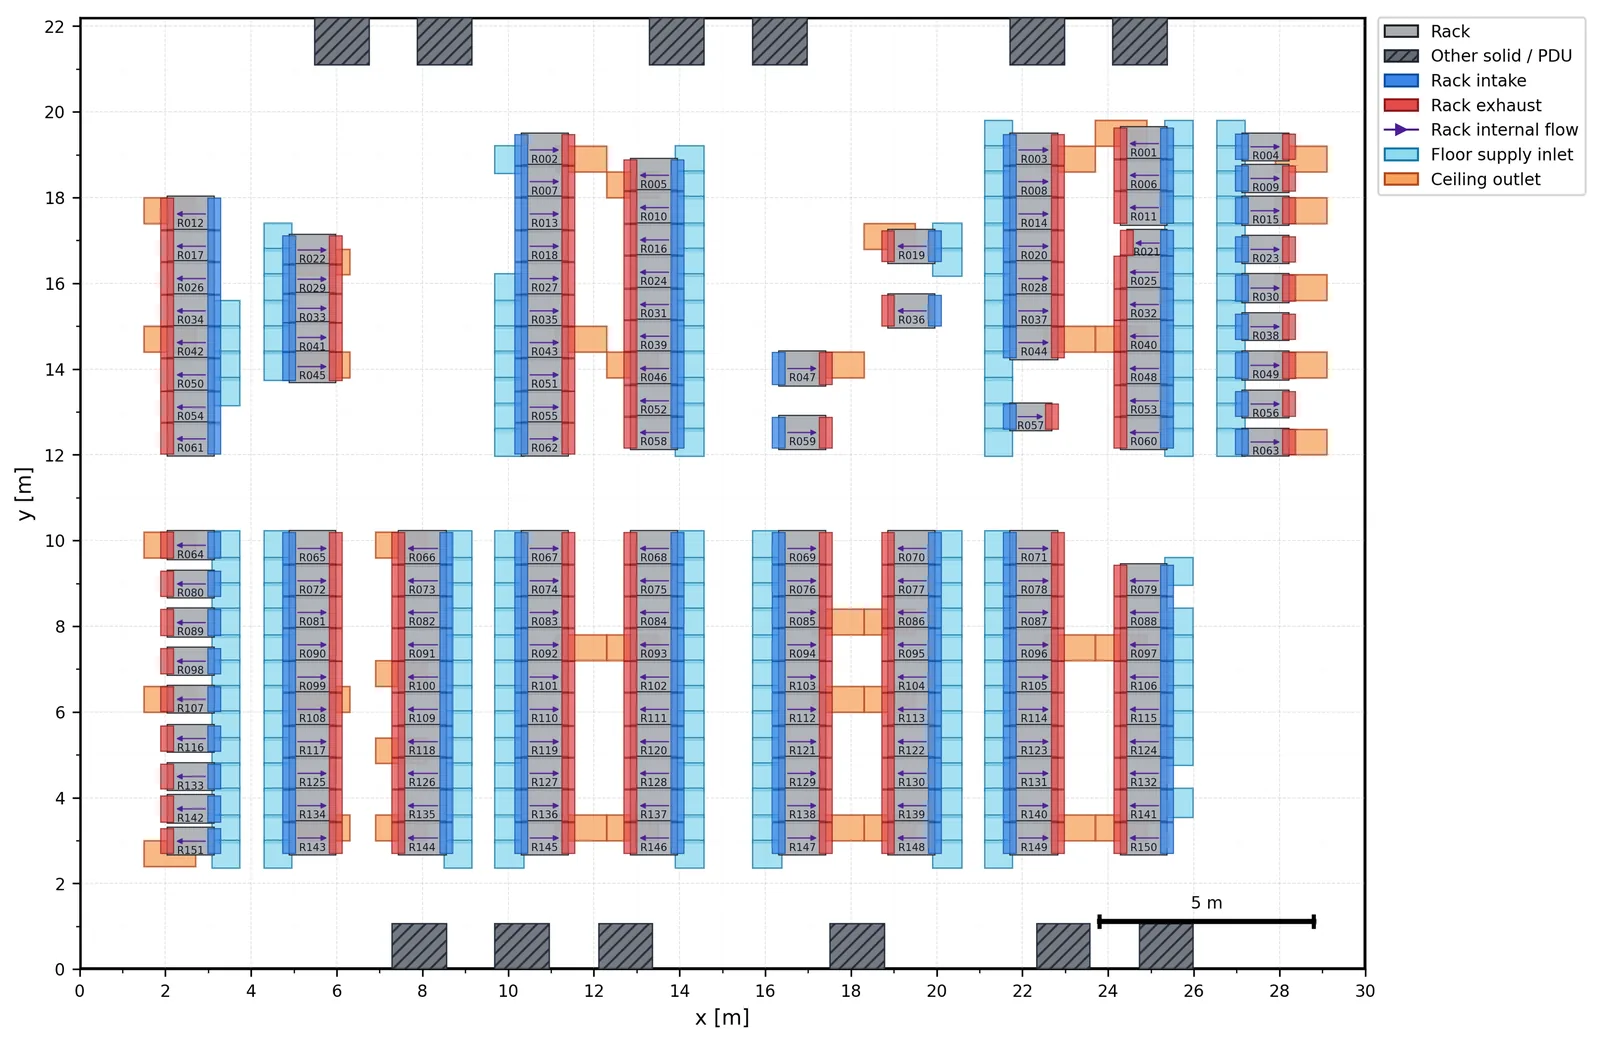
The Boreas model reconstructs this irregular layout in a 30.0 m × 22.2 m × 3.3 m domain. Each rack is treated as a black-box recirculator that takes air in at its inlet face, applies the specified flow rate and heat load, and discharges it at the opposite outlet face; the PDUs are modelled as adiabatic solids. Floor perforated tiles are converted into supply boundaries, and 42 return boundaries are placed at the ceiling.
3. Analysis conditions
| Item | Value |
|---|---|
| Domain | 30.0 m × 22.2 m × 3.3 m |
| Rack recirculation boundaries | 151 |
| PDUs | 12 |
| Floor supply boundaries | 183 |
| Ceiling return boundaries | 42 |
| Total rack heat load | 344 kW |
| Total flow through racks | 72,928 m³/h |
| Total floor supply volume | 152,000 m³/h |
| Supply and initial temperature | 20°C |
Flow through the racks was set at 212 m³/h per kW of IT heat load, as in the reference literature. For a total rack heat load of 344 kW this gives 72,928 m³/h through the racks. Supply velocities were specified per location across the 183 floor perforated tiles, and the sum of their flow rates equals the total cooling supply volume in the reference literature, 152,000 m³/h.
4. Results
4.1 Steady-state temperature distribution
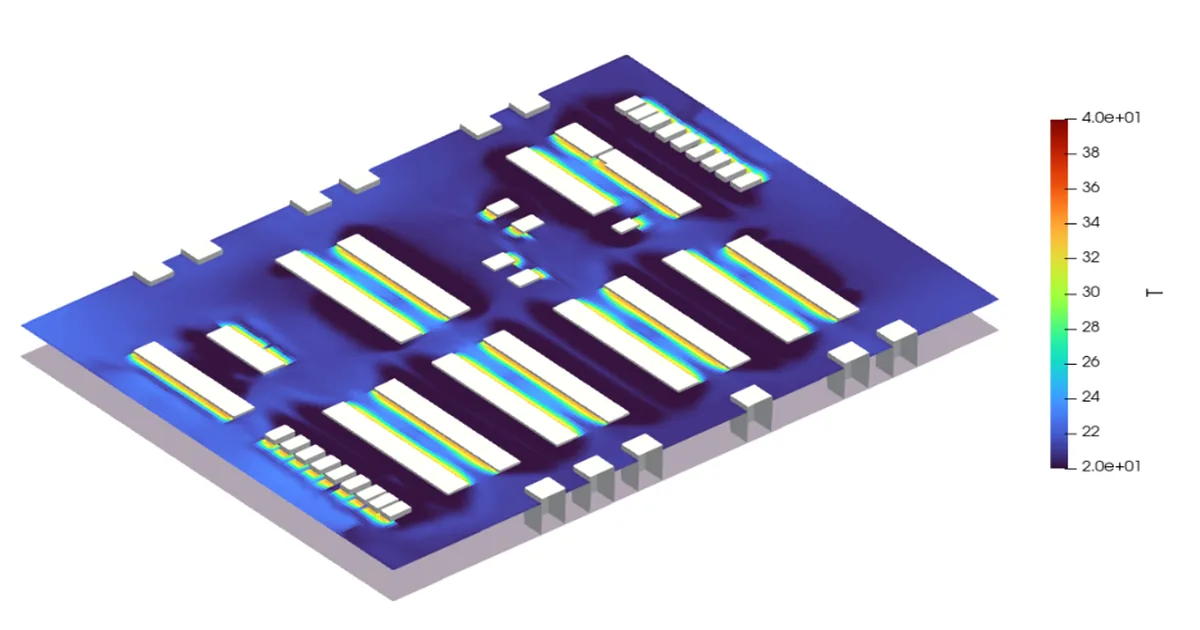
On the horizontal section at z = 1.67 m, the cold regions of the cold aisles and the hot regions of the hot aisles are clearly separated. The temperature legend spans 20 to 40°C.
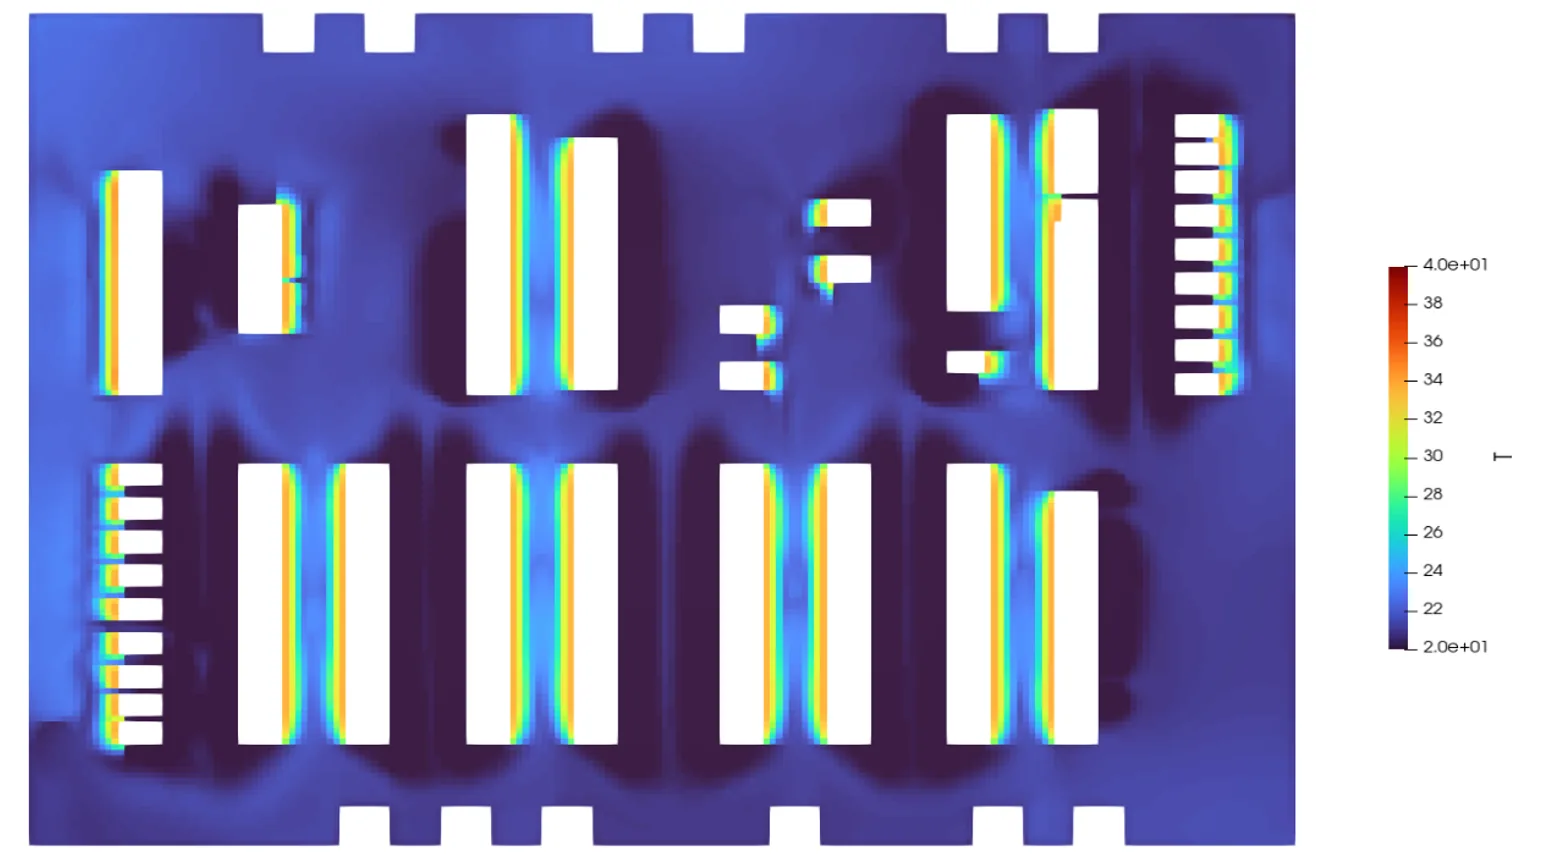
Along the long rack rows a continuous hot region forms behind the outlet faces. At standalone racks and short rack groups, local temperature rises appear around individual outlet faces. The rack inlet side and the open floor area are mostly in the range of about 20 to 24°C.
4.2 Rack inlet and outlet temperatures
Flow-weighted mean temperatures across all 151 racks give inlet temperatures from 20.00 to 20.64°C and outlet temperatures from 30.46 to 33.95°C.
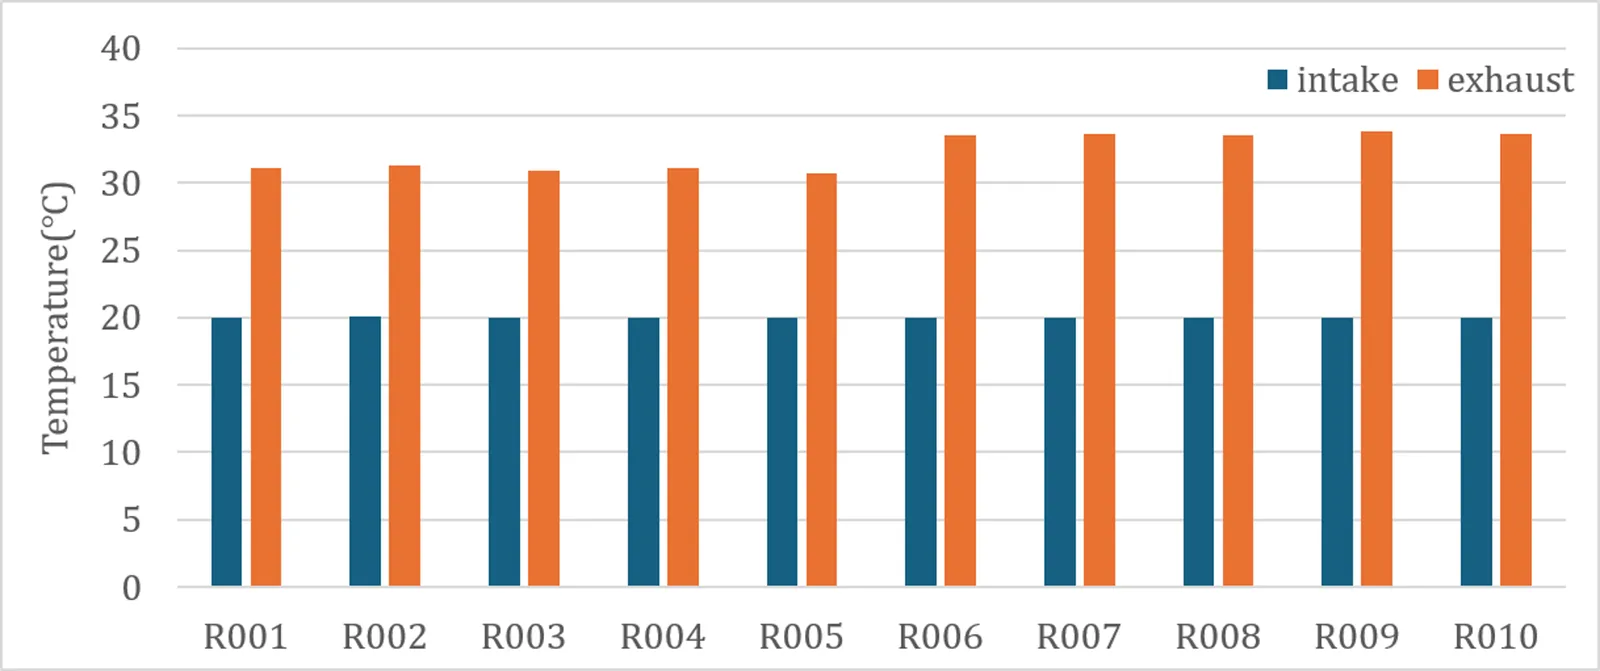
Inlet temperatures for R001–R010 were nearly constant at about 20°C. Outlet temperatures were about 31°C for R001–R005 and about 34°C for R006–R010, a difference of about 3°C between the two groups.
Across all racks the lowest inlet temperature was 20.00°C at R006 and the highest 20.64°C at R012, a spread of 0.64°C. Outlet temperature was lowest at R146 with 30.46°C and highest at R041 with 33.95°C, a range of 3.49°C.
An inlet temperature spread of only 0.64°C means that all 151 racks are effectively supplied with air at the same temperature, indicating that cooling is delivered evenly under this layout and these supply conditions. The 3.49°C range in outlet temperature follows from differences in per-rack heat load and flow rate.
4.3 Flow field and recirculation
Three-dimensional streamlines show the cool flow around the racks and the path taken by air heated on the outlet side.
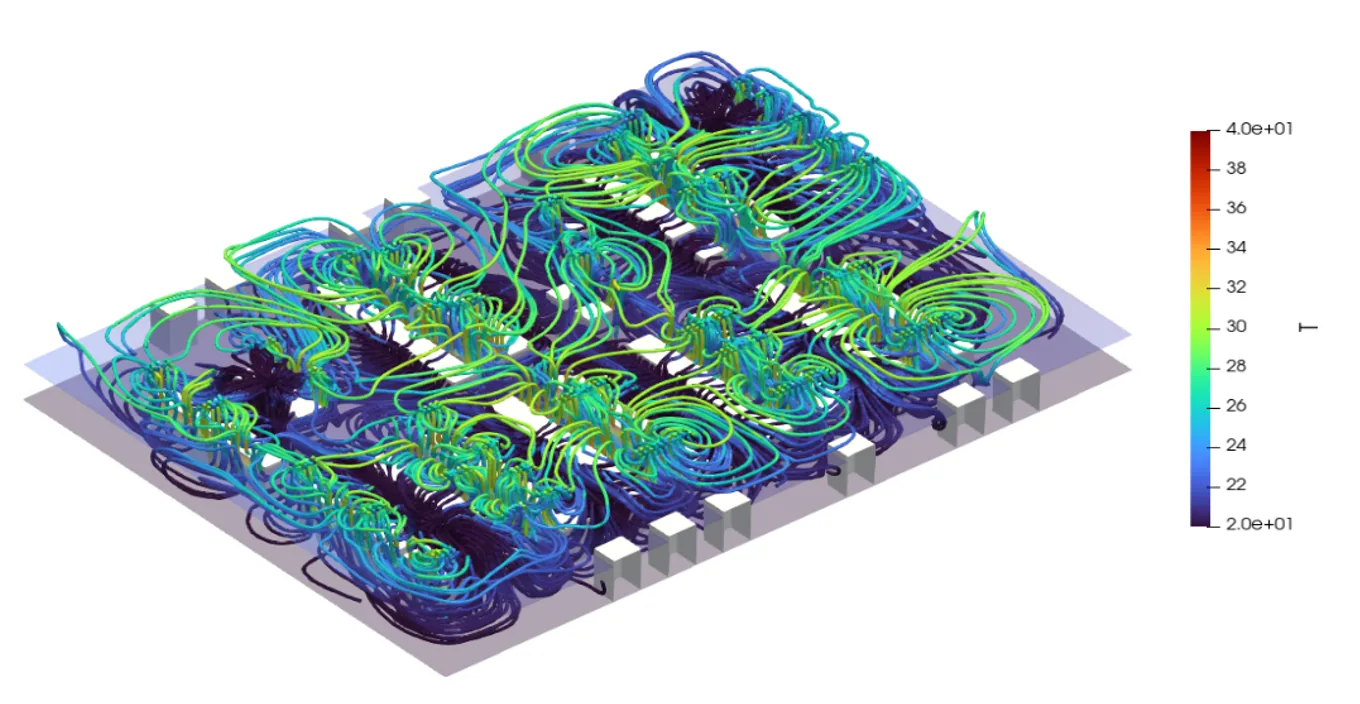
Heated air on the rack outlet side rises and then spreads towards the ceiling and the perimeter space. At the ends of the rack rows, a recirculation appears in which exhaust air travels around the end of the aisle and back to the inlet side.
Recirculation is hard to identify from per-rack mean inlet temperature alone, and it is often improved by changing the rack row arrangement or by adding end-of-row containment. Once such regions are identified while comparing layouts, those zones can be selected for detailed CFD review.
5. Conclusions
Running a Boreas analysis on a full-scale, irregularly laid out data center produced the following.
- A global temperature field from horizontal, vertical and multiple sections
- Per-rack inlet and outlet temperatures — inlet spread of 0.64°C, outlet range of 3.49°C
- Upward flow above the racks, flow around the ends of the rack rows and the perimeter circulation path
- Comparative data on cooling performance under different layouts and supply conditions
A Boreas analysis can be used ahead of detailed CFD to select the zones where cooling performance may be poor and the operating conditions that need further review.
This case study does not include quantitative validation. Verification that the solver solves the governing equations accurately is carried out separately against 11 literature benchmarks including the lid-driven cavity (Ghia 1982), natural convection (de Vahl Davis 1983) and a heated duct (Vardan & Dunn 1997); the conditions and results are collected in the technical documentation.
References
- Tian, W., VanGilder, J., Condor, M., Han, X., and Zuo, W. “An Accurate Fast Fluid Dynamics Model for Data Center Applications.”
- Han, X., Tian, W., VanGilder, J., Zuo, W., and Faulkner, C. “An Open Source Fast Fluid Dynamics Model for Data Center Thermal Management.”
- Pardey, Z. M., VanGilder, J. W., Healey, C. M., and Plamondon, D. W. “Creating a Calibrated CFD Model of a Midsize Data Center.” InterPACK-ICNMM 2015.